The complete project controls platform
Build the schedule. Prove the delay. Own the room.
TideLine takes your programme from baseline to boardroom — CPM scheduling, executive timelines, quality scoring, earned value, forensic delay analysis and Monte Carlo risk, in one platform. No rebuilding slides. No switching tools. No lost evidence.
8
Specialised modules
5
Quality standards
4
Delay methods
2-in-1
Schedule + cost risk
Create your timeline
Try it now — this is the TideLine engine, live.
Built on the standards your reviewers already trust
DCMA 14-Point
Schedule health assessment
GAO
Schedule Assessment Guide
AACE RP-90R-19
Recommended practice
NDIA PASEG
Planning & scheduling
USACE / NAVFAC
Federal schedule specs
SCL Protocol
Delay & disruption methods
One platform, one storyline
From first activity to final exhibit
Every module works on the same programme data. What you build in Schedule is what Metrics measures, what Delay analyses and what Reports presents — nothing is re-keyed, exported or lost in between.
01
Build it — or import it
Start from a blank timeline, a plain-language description, or your existing P6 XER and MS Project files. Full CPM engine: logic, calendars, constraints, baselines.
02
Measure it
Score quality against five industry standards, track earned value and activity statistics, and simulate schedule and cost risk — all on the live programme.
03
Prove it
When the job slips, windows analysis compares schedules period by period, traces the driving paths, and ties every day of delay to a cause and a responsible party.
04
Present it
Executive Gantt boards, status reports, three-band comparison exhibits and evidence packs — exported to PowerPoint, PNG and PDF without rebuilding a single slide.
Eight modules. Zero gaps.
Start with scheduling at $10/month and add the forensic and risk tools when the stakes rise.
Schedule
Build CPM programmes and present them as board-ready timelines, roadmaps and reports
Design
Deliverables with rules of credit, activity links and full design-stage EVM
Quality
DCMA 14-point and four more standards, with your own weights and limits
Metrics
Earned value, activity statistics and delay stats — status reports from live data
Delay
Windows analysis on two P6 schedules — or PDF schedules — with full traceability
Risk
Monte Carlo schedule and cost risk with tornado charts and contingency sizing
Extractor
AI-assisted extraction from emails, RFIs, minutes and PDF schedules into dated events
Reports
Board-ready PDF, DOCX and PPTX evidence packs
Schedule module
Schedules built for the boardroom, not just the site cabin
A full CPM workspace — activities, WBS, logic, calendars, constraints, progress — whose real strength is presentation. Swimlanes, seven live Gantt layouts, conditional formatting and bespoke task-table styling turn the same model into executive timelines, strategic roadmaps, small-project plans and EV-backed status reports. Nothing is ever rebuilt in PowerPoint.
- ■Seven live Gantt layouts with custom bars, colours, fonts and table formats
- ■Executive roadmaps, strategic plans and presentation timelines
- ■Earned-value backed status for high-level programme reporting
- ■Import P6 XER/PMXML and MS Project XML — export editable PPTX, PNG, PDF
7
Live Gantt layouts
CPM
Full logic engine
PPTX
Editable board export
0
Slides rebuilt by hand
Delay module · Windows analysis
Forensic windows analysis — even when all you have is a PDF
Compare two P6 schedules — or a chain of snapshots — across a window. TideLine identifies the driving paths, traces logic back to the first driving activities and filters the top critical paths you want to focus on. No native XER? Extract a PDF schedule into a structured table and analyse it anyway. Assign responsibility, delay events and claim type, group findings into high-level explanations with full traceability, and push the window into Schedule as a three-band comparison for the report.
- ■Two-schedule comparison with driving-path and logic tracing
- ■PDF schedule extraction when the native XER is unavailable
- ■Responsibility, cause, claim type and concurrency per finding
- ■Push grouped windows into a 3-band schedule comparison exhibit
Windows
Period-by-period analysis
3-band
Window comparison exhibit
PDF→Table
No native file required
Traceable
Snapshot to finding
Metrics module
Status reports written by the schedule itself
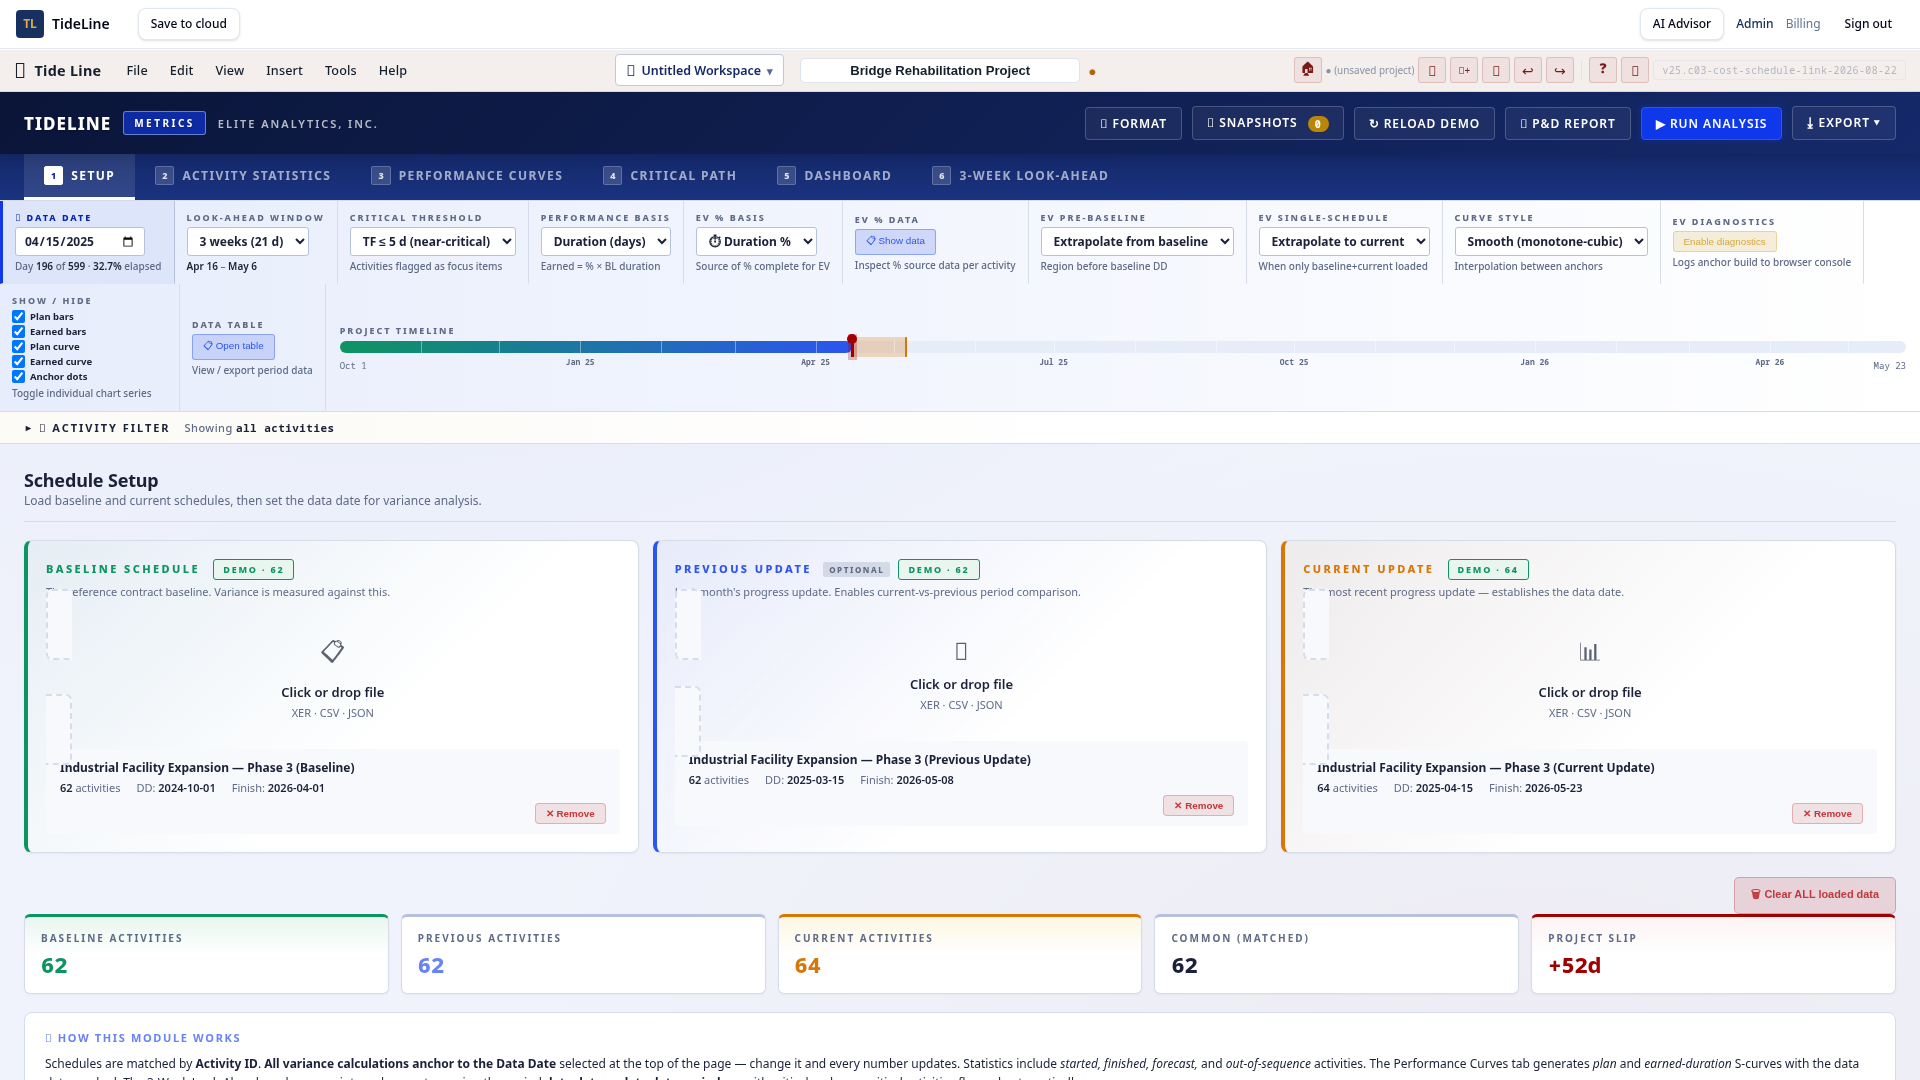
Metrics analyses the live programme and produces the status update for you: earned value (PV, EV, AC, SPI, CPI, EAC), activity statistics, float and delay statistics, planned vs actual S-curves and productivity trends across every update. Drill from any index down to the activities driving the variance — then export the dashboard straight into the monthly report.
- ■Full EVM: SPI, CPI, SV, CV, EAC and forecast completion
- ■Activity, float and delay statistics across every update
- ■Planned vs actual vs earned S-curves with drill-down
- ■Status-update report exports for owners and executives
8+
EVM indices computed
Live
Forecast completion
S-curves
Planned vs actual vs earned
Trended
Update over update
Risk module
Know the programme is achievable before you sign it off
TideLine Risk runs Monte Carlo simulation on both schedule and cost at the same time. Model three-point uncertainty, correlated activities and discrete risk events, then read P10–P90 completion dates, cost exposure, tornado-ranked drivers and the contingency you need for your target confidence level.
- ■Schedule + cost joint simulation over the live CPM network
- ■Tornado charts that rank the real drivers of time and cost
- ■Contingency sizing to any P-value confidence target
- ■Risk register with mitigation tracking and pre/post comparison
P10–P90
Completion dates & cost
Tornado
Ranked risk drivers
Joint
Schedule + cost model
Correlated
Related risk events
Built by practitioners, not just programmers
Software and consulting under one roof
TideLine is built by Elite Analytics Inc., a Toronto-based project controls and construction claims consultancy. Every module encodes the workflow our consultants use on real commissions — forensic delay analysis, EOT submissions, schedule quality reviews, risk assessment and expert witness support. Use the software yourself, or bring our team in to run the analysis with you.
- ■Years of live project controls and claims practice behind every feature
- ■Software, training and consulting from the same team
- ■Expert-witness-grade traceability built in from day one
- ■Per-organisation data isolation, encrypted at rest and in transit
Toronto, CA
Claims & project controls consultancy
Expert grade
Evidence and audit trail standard
End to end
Schedule → analysis → report
Same team
Software + consulting services
Simple plans
Per organisation. Two months free when you pay annually.
Starter
$10/month
or $100/year
Build, update and present CPM programmes.
Most popular
Professional
$29/month
or $290/year
Schedule + Design + Quality + Metrics — build and prove schedule health.
Max
$49/month
or $490/year
Everything — adds Delay, Risk, Extractor and Reports for forensic claims work.
AI Advisor
$79/month
or $790/year
Everything in Max plus the AI analyst — reports, schedule comparison, drafting and Q&A.
Built for the standard of proof
- ■Import Primavera P6 (XER/XML) and keep your native data untouched — every analysis is reproducible.
- ■Export PDF, DOCX and PPTX evidence packs formatted for adjudication, arbitration and court.
- ■Per-organisation data isolation, encrypted at rest and in transit, with a full audit trail.
- ■Grow with the job — start on Starter and move to Max the day forensic work begins.
See it in action
Product walkthroughs
Real screen recordings of TideLine — no mockups, no slideware.
Building a presentation-ready schedule
Watch a board-ready schedule come together — swimlanes, hierarchy, bar formatting and export in one pass.
Windows delay analysis, end to end
Compare two P6 schedules, trace the driving path, assign responsibility and push the window into Schedule as an exhibit.
PDF schedule extraction for delay analysis
Turn a PDF schedule into structured activities — extract the table, review the data and feed it straight into delay analysis.
Monte Carlo schedule and cost risk
Apply duration and cost ranges, register risk events, run the simulation and read P10–P90 outcomes, tornado drivers and contingency.